Welcome to our deep dive into one of the most critical, yet often overlooked, tasks on any job site: the progress report. For tradespeople, from electricians and plumbers to HVAC techs and general contractors, clear, consistent reporting isn't just paperwork; it's the backbone of efficient project management, client trust, and timely payments. A well-crafted report bridges the communication gap between the field and the office, prevents misunderstandings, and creates an undeniable record of work completed.
This guide moves beyond generic templates. We will break down 7 essential project progress report examples, transforming them into powerful tools specifically for the trades. You will learn how to analyze each format, adapt them to real-world job sites, and streamline your entire reporting process. To maximize efficiency and accuracy in your project updates, consider leveraging advanced solutions like AI-generated reports that streamline data compilation.
We'll cover everything from simple weekly updates to more complex RAG status dashboards and earned value reports. Get ready to turn your daily updates into a strategic asset that keeps projects on track and drives your business forward.
1. Status Dashboard Report
A Status Dashboard Report is a visual, at-a-glance summary of a project's health. Instead of dense text, it uses charts, graphs, and color-coded indicators (like green, yellow, and red) to present key performance indicators (KPIs). For a busy tradesperson or operations manager, this format quickly answers critical questions: Are we on schedule? Are we on budget? What are the biggest roadblocks?
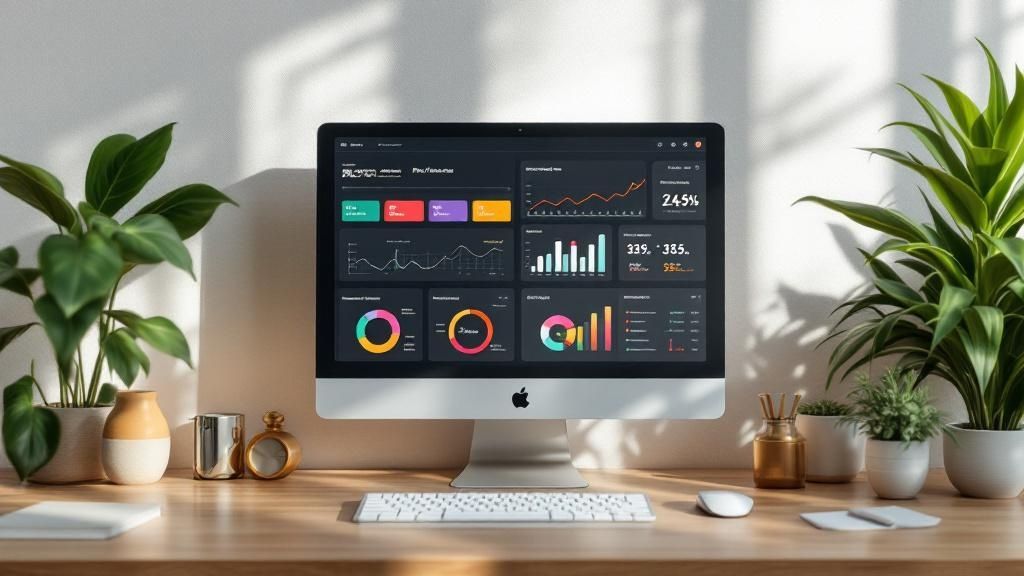
This type of project progress report example is powerful because it translates complex job site data into an easily digestible visual story. It’s ideal for weekly team huddles, updates to clients, or high-level reviews with management who don’t need to get lost in the day-to-day details.
Strategic Analysis
The core strength of a dashboard is its immediacy. A project manager can instantly spot a budget overrun marked in red or a task timeline falling behind marked in yellow. This visual cue prompts immediate action rather than requiring someone to read through pages of text to find the problem.
Key Insight: Dashboards shift the reporting focus from what happened to what needs attention now. This proactive approach is crucial in the trades, where a small delay can have significant ripple effects on scheduling and material delivery.
For example, an HVAC company managing a multi-unit residential installation can use a dashboard to track unit installation rates, material inventory, and labor hours per building. If one building’s progress is in the red, the team can investigate immediately.
Actionable Takeaways
To effectively implement a Status Dashboard Report, follow these steps:
- Limit Your Metrics: Don’t clutter the dashboard. Focus on 5-7 critical KPIs, such as Budget vs. Actual, Schedule Variance, Task Completion Rate, and Open Issues/Risks.
- Use Consistent Color-Coding: Standardize your signals. For instance, Green means on track, Yellow indicates a potential issue or slight delay, and Red signals a critical problem requiring immediate intervention.
- Automate Data Feeds: Whenever possible, link your dashboard to your data sources (like job management software or spreadsheets). This ensures the report is always based on the latest information, saving you from manual updates. Popular tools like Smartsheet or Power BI excel at this.
- Add Brief Annotations: For any red or yellow status indicators, include a short, one-sentence note explaining the cause and the planned next step. This provides context without cluttering the visual.
2. Weekly Status Report
A Weekly Status Report is a structured, recurring update that provides stakeholders with a consistent rhythm of communication. This project progress report example moves beyond the high-level dashboard to offer more detail on recent accomplishments, planned activities for the next week, and any emerging issues. For a plumbing contractor or an electrical team lead, this report keeps the client, office staff, and crew aligned, ensuring no one is surprised by project developments.
It is the workhorse of project communication, ideal for keeping momentum and documenting the project journey week by week. This format is perfect for formal client updates, internal team meetings, and tracking progress against a baseline plan, as popularized by frameworks from the Project Management Institute (PMI).
Strategic Analysis
The power of a Weekly Status Report lies in its consistency and predictability. Stakeholders know exactly when to expect an update and what information it will contain. This routine builds trust and reduces the need for ad-hoc "what's the status?" calls or emails, freeing up the project manager to focus on execution.
Key Insight: The weekly report creates a documented history of the project. It transforms verbal updates into a formal record, which is invaluable for clarifying past decisions, resolving disputes, and demonstrating progress over time.
For example, a landscaping crew on a multi-phase commercial installation can use the weekly report to document which zones were completed, what materials were used, and any client-approved changes. If a question arises a month later about a specific plant choice, the report provides a clear, time-stamped answer.
Actionable Takeaways
To make your Weekly Status Report effective, follow these steps:
- Standardize Your Sections: Stick to a consistent template. Always include sections like Accomplishments This Week, Plans for Next Week, Issues/Risks, and Key Decisions Made.
- Be Concise and Factual: Use bullet points to list achievements and tasks. Instead of writing "we did a lot of work," state "Installed 5 of 10 HVAC units" or "Completed rough-in electrical for the main floor."
- Highlight What’s Changed: Use bold text or a dedicated "Changes" section to draw attention to any deviations from the original plan, such as a scope change or a new risk.
- Quantify Progress: Include metrics where possible. Mentioning "75% of drywall installed" is much more informative than "drywall installation is ongoing." This ties directly into creating a more comprehensive project progress report example.
3. Milestone Achievement Report
A Milestone Achievement Report focuses on significant project accomplishments rather than day-to-day task lists. It tracks progress against major, pre-defined goals or phases. For a landscaping company installing a complex irrigation system, milestones could be "Trenching Complete," "Mainline Installed," and "System Commissioned." This report format is perfect for keeping clients and stakeholders informed about tangible forward movement without bogging them down in minor details.

This type of project progress report example is particularly effective for long-term projects with distinct phases. It helps maintain momentum and demonstrates clear value delivery at critical junctures, making it ideal for client billing cycles or formal reviews with project financiers.
Strategic Analysis
The strength of a Milestone Achievement Report lies in its narrative power. It tells a story of progress by highlighting completed chapters of the project. This is psychologically satisfying for both the team and the client, reinforcing a sense of accomplishment and building confidence in the project's trajectory.
Key Insight: This report shifts the conversation from activity to achievement. Instead of just listing hours worked, it showcases the concrete results of that work, directly linking effort to business value and project completion.
For instance, an electrical contractor rewiring an old commercial building would define milestones like "Old Wiring Demolition," "New Conduit Run," and "Final Panel Installation." Hitting each milestone is a clear, celebrated victory that proves the project is advancing as planned.
Actionable Takeaways
To effectively use a Milestone Achievement Report, implement these strategies:
- Define Clear Milestones Upfront: Before the project starts, work with the client to define what each milestone is and what "done" looks like. Document this in the project scope.
- Link Milestones to Payments: For fixed-price or long-term jobs, align milestone completions with payment schedules. This creates a clear, fair system for billing and cash flow management.
- Include Quality Metrics: Don't just state a milestone is "complete." Add a note on quality checks, such as "Foundation Poured and Passed Inspection," to build trust and demonstrate thoroughness.
- Document Lessons Learned: After each milestone, briefly note what went well and what could be improved for the next phase. This turns the report into a tool for continuous improvement on the job.
4. RAG (Red-Amber-Green) Status Report
A RAG (Red-Amber-Green) Status Report uses a simple, intuitive traffic light system to communicate the health of project components. Key areas like budget, schedule, scope, and resources are each assigned a color: Red for critical issues needing immediate action, Amber (or yellow) for potential problems that require monitoring, and Green for on-track items. This format is a go-to for many project management offices and large organizations.
For a landscaping company managing multiple commercial properties, a RAG report can instantly show which sites are behind schedule or over budget. This clear, high-level project progress report example is perfect for portfolio reviews where executives need to quickly understand the status of many projects without getting bogged down in specifics.
Strategic Analysis
The power of the RAG report lies in its standardization and simplicity. By establishing clear, objective criteria for what constitutes red, amber, or green, it removes ambiguity from project reporting. This system forces project managers to make a definitive judgment call on the health of each project component, preventing vague or overly optimistic updates.
Key Insight: RAG reports are designed to drive accountability. A "red" status is not just a warning; it's a trigger for a mandatory escalation and a required recovery plan, ensuring problems are addressed systematically.
For example, an electrical contractor could define "Amber" for the budget as a 5-10% variance and "Red" as anything over 10%. If a project's material cost goes red, the protocol might require an immediate meeting between the project manager and the operations manager to approve a recovery plan.
Actionable Takeaways
To make your RAG Status Report effective, implement these strategies:
- Define Clear Criteria: Before starting, document exactly what each color means for each category. For schedule, green might be "on time," amber "1-2 weeks delay," and red "more than 2 weeks delay."
- Always Provide Context: A red or amber status is useless without an explanation. For each, include a concise summary of the issue, its impact, and the specific actions being taken to resolve it.
- Include Trend Arrows: Add arrows (↑, →, ↓) next to each status indicator to show if the situation is improving, stable, or worsening since the last report. This adds a crucial layer of forward-looking insight.
- Focus on Recovery: The goal of a red status is not to assign blame but to trigger a solution. Ensure every red item has a linked, time-bound recovery plan with a clear owner.
5. Earned Value Management (EVM) Report
An Earned Value Management (EVM) Report is a powerful, quantitative method for measuring project performance. It goes beyond simple budget vs. actual comparisons by integrating three critical elements: the scope of work, the project schedule, and the costs. For large-scale jobs, like a commercial HVAC installation or a multi-phase electrical fit-out, EVM provides an objective, data-driven look at where the project truly stands.
This type of project progress report example answers the fundamental question: "What did we get for the money we spent?" It's a favorite in industries like defense, aerospace, and large construction because it provides early warning signs of schedule delays or cost overruns, allowing managers to forecast the final project outcome with surprising accuracy.
This bar chart visualizes the core relationship in EVM between Planned Value (PV), Earned Value (EV), and Actual Cost (AC) at a specific point in time.
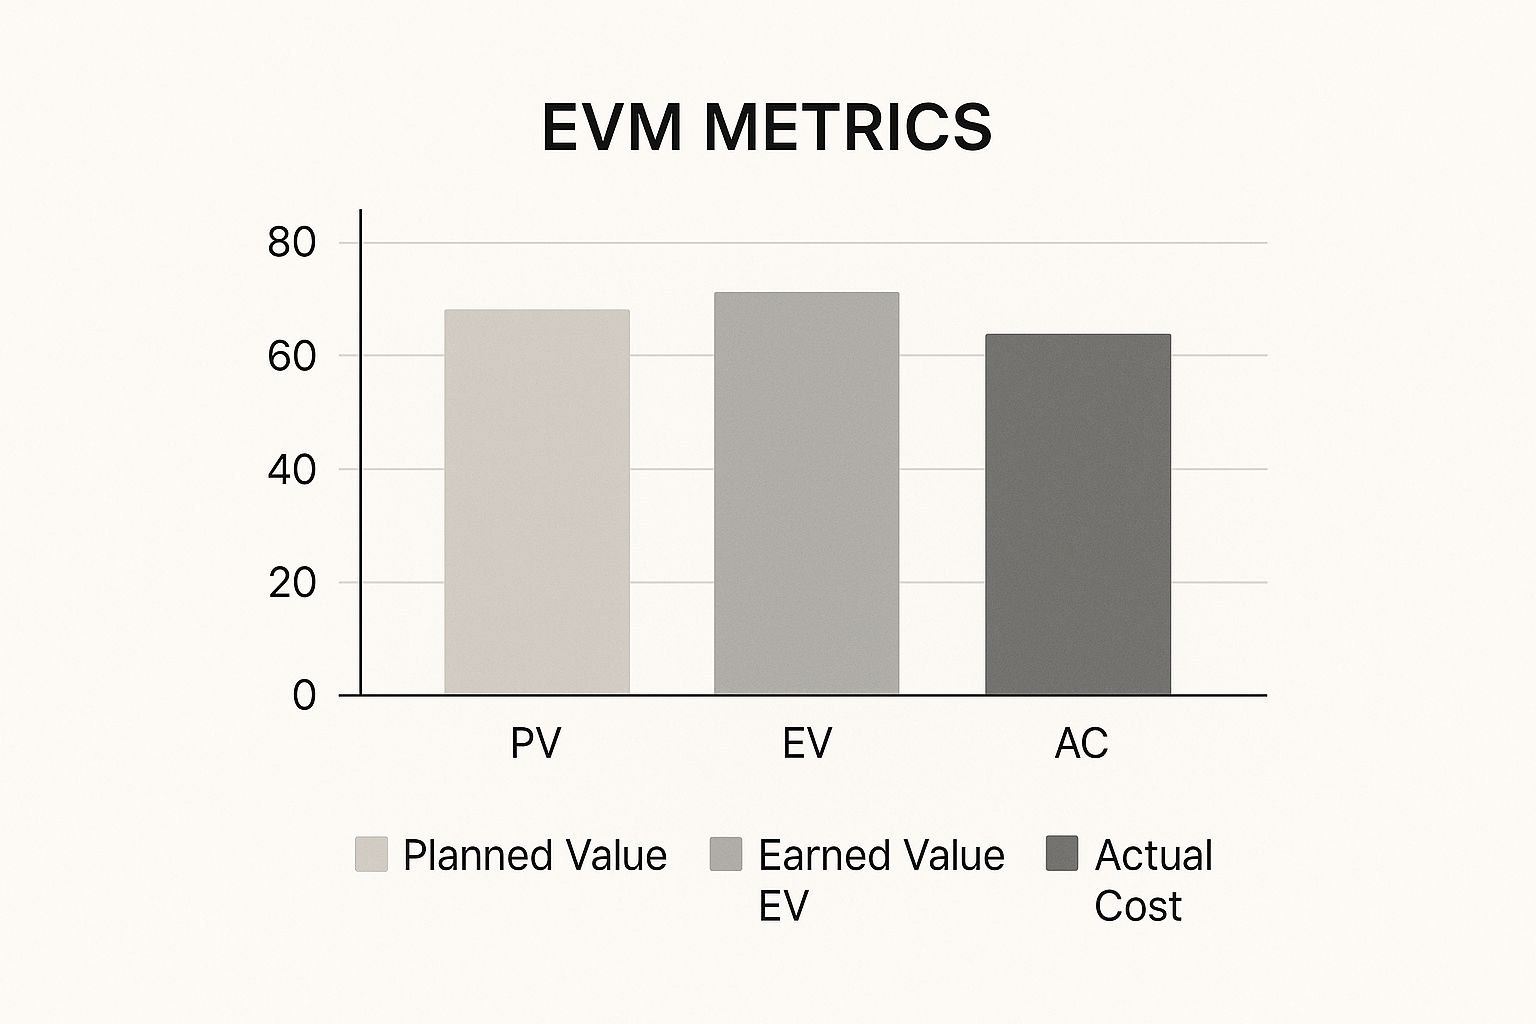
The chart clearly shows that while the project has spent less than planned (AC is below PV), the value of the work completed (EV) is even lower, indicating the project is both behind schedule and performing inefficiently.
Strategic Analysis
The strategic power of EVM lies in its predictive capabilities. By calculating metrics like the Schedule Performance Index (SPI) and Cost Performance Index (CPI), a project manager can objectively assess efficiency. An SPI below 1.0 means you're behind schedule, while a CPI below 1.0 means you're over budget for the work completed.
Key Insight: EVM forces a discipline of planning and tracking that connects every dollar spent to a tangible piece of completed work. It moves the conversation from "How much have we spent?" to "Is our spending generating the expected value?"
For example, a plumbing contractor on a large build can use EVM to see if they are on track. If they've spent 50% of the labor budget but have only completed 35% of the rough-ins (the earned value), they know they are critically behind and over budget, allowing them to take corrective action early.
For a deeper dive into the core concepts of EVM, this video provides a clear explanation:
Actionable Takeaways
To use EVM reporting effectively on your projects, follow these key steps:
- Establish a Detailed Work Breakdown Structure (WBS): Break the entire project scope into small, manageable work packages. Each package should have a defined budget (this becomes your Planned Value or PV).
- Objectively Measure Progress: For each work package, define how you will measure "done." This could be a percentage of completion or a binary 0/100 (not started/completed). This measurement determines your Earned Value (EV).
- Track Costs Diligently: Accurately record all actual costs (AC) associated with each work package. This includes labor, materials, and subcontractor fees.
- Focus on Trends: A single EVM report is a snapshot. The real power comes from tracking your CPI and SPI over time. A downward trend is a major red flag that requires immediate investigation and action.
6. Scrum Sprint Report
A Scrum Sprint Report is an agile project progress report that focuses on short, iterative cycles of work called "sprints." It summarizes what the team accomplished during a specific sprint (typically 1-4 weeks), tracks performance metrics like team velocity, and outlines plans for the next cycle. For teams adopting more flexible, responsive workflows, like a custom fabrication shop or a tech-focused service company, this report tracks iterative progress rather than a single, long-term project plan.
This type of project progress report example is crucial for agile environments where priorities can shift quickly. It provides a structured way to measure productivity, highlight completed work, and identify obstacles, ensuring the team continuously adapts and improves its processes. It’s perfect for weekly team reviews and stakeholder updates in fast-moving projects.
Strategic Analysis
The strategic power of a Scrum Sprint Report lies in its emphasis on continuous improvement and transparency. By focusing on short cycles, it forces teams to break large, complex jobs into manageable pieces, deliver value faster, and learn from each cycle. The burndown chart visually shows work remaining versus time, creating a clear and immediate sense of urgency and progress.
Key Insight: Sprint reports change the conversation from "Are we finished yet?" to "What did we accomplish, what did we learn, and how can we be more effective next sprint?" This mindset is invaluable for trades that involve custom work or complex problem-solving.
For instance, an electrical team implementing a new smart home automation system across a commercial building can use sprints to tackle one floor at a time. The sprint report would show which features were successfully deployed (e.g., automated lighting, security sensors) and highlight any technical roadblocks encountered, which informs the plan for the next floor.
Actionable Takeaways
To effectively implement a Scrum Sprint Report, follow these steps:
- Showcase Demo-able Features: Don’t just list completed tasks. Highlight tangible outcomes or finished components that stakeholders can see and understand. This makes progress feel real.
- Visualize Progress with a Burndown Chart: This simple chart is the heart of the report. It should plot the planned work against the actual work completed each day of the sprint, providing an instant visual on whether the team is on track.
- Track Team Velocity: Measure the amount of work your team completes each sprint. Tracking this trend over time helps you make more accurate forecasts for future work and identify dips in productivity early.
- Include Retrospective Insights: End the report with key takeaways from the sprint retrospective. Briefly mention 1-2 things that went well and 1-2 specific process improvements the team will implement in the next sprint. This demonstrates a commitment to getting better.
7. Exception-Based Progress Report
An Exception-Based Progress Report flips the traditional model on its head. Instead of detailing every task that is going according to plan, it focuses exclusively on what is not—the exceptions. This report zeroes in on deviations from the schedule, budget overruns, unexpected risks, and any other issue requiring management attention. For a busy business owner overseeing multiple crews, it cuts through the noise and immediately flags where their help is needed.
This type of project progress report example is designed for efficiency, respecting the limited time of senior leaders or clients. It operates on the "no news is good news" principle. If a task or budget line isn't mentioned, it’s assumed to be on track. This makes it perfect for high-level briefings, crisis management, or turning around a troubled project where focus is paramount.
Strategic Analysis
The power of this report lies in its focus and urgency. By stripping away the updates on what's working, it forces all stakeholders to concentrate on solving problems. This is particularly effective in trades like commercial plumbing or electrical work, where a single major issue, like a failed inspection or a critical material delay, can halt the entire project.
Key Insight: This report format changes the conversation from "How are things going?" to "What must we solve right now?" It transforms the reporting process from a passive update into an active problem-solving session.
Imagine a large-scale landscaping project where a subcontractor fails to deliver mature trees on schedule. An exception-based report would skip the status of the new irrigation system (on schedule) and the patio installation (on budget) to spotlight the tree delay, its impact on the project timeline, and the proposed solutions.
Actionable Takeaways
To use an Exception-Based Progress Report effectively, you need to establish trust and clear parameters:
- Define the Thresholds: Clearly define what constitutes an "exception." For example, any task delayed by more than two days, any budget item over by 5%, or any new high-priority risk.
- Context is Crucial: Never just state the problem. Briefly explain why it's an exception and what its potential impact is on the overall project goals (e.g., "HVAC unit delivery delayed 3 days, risking failure to meet client handover date").
- Always Propose a Solution: For every exception listed, include a recommended action plan. This shows you're not just reporting problems but are actively managing them. Include a recovery timeline showing how the proposed action will get the project back on track.
- Balance with a Quick Summary: While the focus is on problems, start with a single sentence confirming that all other aspects are proceeding as planned. This prevents unnecessary panic and reassures stakeholders that you have the rest of the project under control.
7 Key Project Progress Report Types Comparison
Bringing It All Together: Your Next Steps to Flawless Reporting
We've navigated a comprehensive toolkit of project progress report examples, moving from the high-level visibility of the Status Dashboard to the detailed, agile focus of a Scrum Sprint Report. Each template, from the intuitive RAG status report to the data-rich EVM analysis, offers a unique lens through which to view your project's health. The ultimate goal isn't to master a single format, but to build a flexible reporting system that serves your specific needs on the job site, whether you're a plumber coordinating a multi-unit installation or an electrician managing a commercial fit-out.
The most powerful takeaway is that effective reporting is not about creating more paperwork. It's about establishing a seamless flow of information from the field to the office, enabling better decisions, clearer client communication, and faster payments. Your reporting system should be so simple that a technician can update it in minutes, not hours.
Key Insights and Actionable Next Steps
To transform these examples into a real-world advantage for your trade business, focus on these core principles:
- Adapt, Don't Just Adopt: The true value lies in customizing these templates. A landscaper might find the Milestone Achievement Report perfect for tracking phases of a large garden installation, while an HVAC company might lean on an Exception-Based Report to flag unexpected equipment failures that require immediate attention. Start with the template that feels most natural for your typical project.
- Prioritize Field-Friendliness: The biggest barrier to accurate reporting is complexity. If your reporting process requires technicians to fill out complicated forms after a long day, it will fail. The system must be built around their workflow, leveraging tools they already use, like their smartphones.
- Emphasize Action Over Data: A report is only useful if it drives action. Is the project behind schedule? The report should clearly state what steps are being taken to catch up. Did you encounter an unexpected issue? The report must outline the proposed solution and its impact on the budget or timeline. Every data point should answer the question, "So what?"
Implementing Your Reporting Strategy
Your journey to flawless reporting starts now. Begin by selecting one or two project progress report examples from this article that best align with your upcoming jobs. Next, simplify the data entry points to the absolute essentials your team needs to capture. This streamlined approach not only improves adoption but also helps you avoid common pitfalls in digital reporting, ensuring your new process is efficient from day one.
Ultimately, mastering project progress reporting gives you more than just a clear view of your work. It builds client trust, minimizes financial risks from scope creep, and empowers your team with the information they need to succeed. By moving beyond manual methods and embracing a smarter, more automated approach, you turn reporting from a dreaded administrative task into a powerful strategic asset for your business.
Ready to eliminate manual data entry and create perfect project reports effortlessly? Discover how Nora, your AI assistant, can automatically transform voice notes, texts, and photos from the field into structured, professional reports. Learn more and see it in action at Nora.